Initiating Coverage |Kitchen Appliances
August 17, 2018
TTK Prestige Ltd.
BUY
CMP
`6237
Growth to revive…
Target Price
`7500
TTK Prestige (TTK) is the leading brands in kitchen appliances with 40%+
Investment Period
12 Months
market share in organized market. It has evolved from being a single product
company to a multi product company offering an entire gamut of kitchen and
home appliances (600+ products). It expects to double its revenue in the next
Stock Info
5 years backed by revival in consumption demand, new 5 cr LPG connections
Sector
Kitchen Appliances
under the Ujjawala Scheme, inorganic expansion and traction in exports.
Market Cap (` cr)
7,210
Leader in product innovation: TTK has been the pioneer in launching new
Net Debt (` cr)
-
products like non-stick cookware, cookers. It has been launching 50-100 new
Beta
0.6
products every year for the past few years which has boosted its revenue growth
52 Week High / Low
8911/5612
while its peers like Hawkins suffered stagnation. It has also launched a economy
range - ‘Judge Cookware’ to capture the untapped demand especially at the
Avg. Daily Volume
3,576
bottom end of the pyramid. It is also expecting good growth in cleaning solutions.
Face Value (`)
10
BSE Sensex
37,663
Favorable market dynamics: Indian Kitchen appliances industry is valued at
`12000cr+ where TTK commands > 15% market share. After posting a couple of
Nifty
11,384
subdued years, we feel that the company is now in sweet spot with revival in
Reuters Code
TTKL.BO
consumption demand, especially rural. 5 cr new LPG connections have rekindled
Bloomberg Code
TTKPT.IN
demand for pressure cookers/cookware. TTK is also scouting for inorganic
opportunities to support its growth plans.
Shareholding Pattern (%)
Strong balance sheet: TTK has been aggressively investing in its manufacturing
Promoters
70.4
capabilities and has invested over ` 500 cr in the last 7-8 years. Looking at
buoyant expected demand, it is incurring a capex of ~`250 cr over FY2019-21.
MF / Banks / Indian Fls
8.4
This capex is to be internally funded from its robust operating cash flows. With
FII / NRIs / OCBs
10.0
improving profitability and debt free status, its return ratios are likely to improve.
Indian Public / Others
11.2
Outlook and valuation: We expect TTK to report a CAGR of 18.6%/24.5% in
revenue/PAT respectively over FY2018-20E. It is currently trading at a P/E of 29x
Abs. (%)
3m
1yr
3yr
FY2020E EPS which is at discount to its 5 year average PE multiple of 40x. Hence,
we initiate coverage on the stock with a BUY and Target Price of `7500 (35x
Sensex
6.4
1.0
35.1
FY2020E EPS), an upside of 21% from the current levels.
TTK Prestige
5.3
1.5
60.0
Key Financials (Consolidated)
Y/E March (` cr)
FY2016
FY2017
FY2018E
FY2019E
FY2020E
Price Chart
Net Sales
1,559
1,837
1,982
2,371
2,788
% chg
12.3
17.8
7.9
19.6
17.6
Net Profit
115.6
150.7
164.5
205.4
247.4
% chg
25.2
30.3
9.2
24.9
20.4
OPM (%)
11.8
11.4
12.7
13.4
13.6
EPS (Rs)
100.0
130.3
142.3
177.7
214.0
P/E (x)
62.4
47.9
43.8
35.1
29.1
P/BV (x)
0.4
0.3
0.3
0.2
0.2
Source: Company, Angel Research
RoE (%)
16.0
17.6
16.1
17.3
17.8
RoCE (%)
22.4
19.0
19.6
22.0
22.7
Nidhi Agrawal
EV/Sales (x)
4.6
3.9
3.6
3.0
2.5
022 - 3935 7800 Ext: 6872
EV/EBITDA (x)
38.8
34.2
28.1
22.1
18.3
Source: Company, Angel Research; Note: closing price of 16th August , 2018
Please refer to important disclosures at the end of this report
1
Initiating Coverage | TTK Prestige
TTK prestige in charts
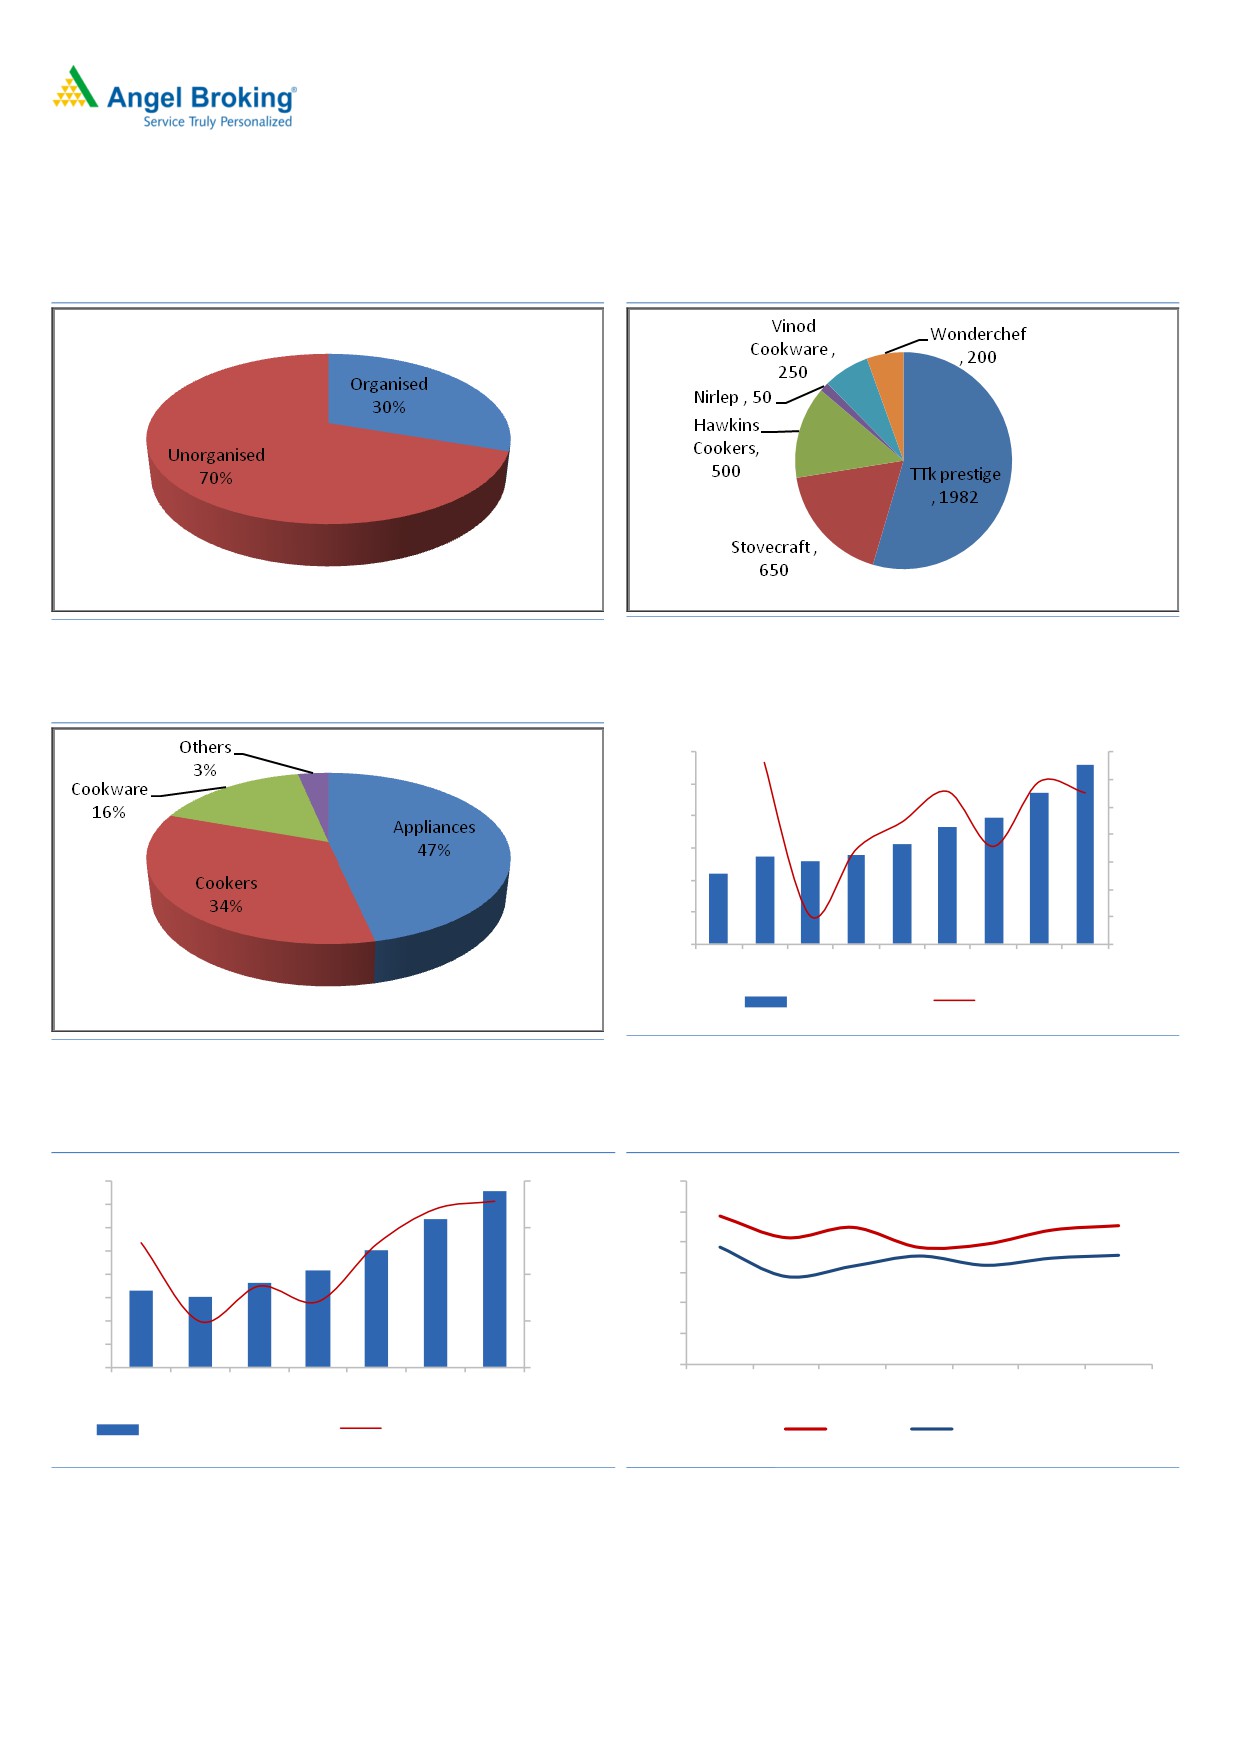
Exhibit 1: Kitchen appliances industry break up
Exhibit 2: Top 6 players by their revenue (`cr)
Source: Industry, Angel Research
Source: Industry, Angel Research
Exhibit 3: TTK’s product wise revenue break up
Exhibit 4: Sales growth to rekindle over next few years
3000
25%
2500
20%
15%
2000
10%
1500
5%
1000
0%
500
-5%
0
-10%
FY12
FY13
FY14
FY15
FY16
FY17
FY18
FY19
FY20
Net Sales- ` cr
YoY chg (%)
Source: Company, Angel Research
Source: Company, Angel Research
Exhibit 5: Improving its margin profile
Exhibit 6: Stable return ratios
400
14.0%
30
350
25
300
13.0%
20
250
200
12.0%
15
150
10
100
11.0%
5
50
0
10.0%
-
FY14
FY15
FY16
FY17
FY18
FY19
FY20
FY14
FY15
FY16
FY17
FY18
FY19
FY20
Operating profit (` cr)
Operating margin (%)
ROE %
ROCE %
Source: Company, Angel Research
Source: Company, Angel Research
August 17, 2018
2
Initiating Coverage | TTK Prestige
Company background
Founded in 1928, the TTK group spans 30 product categories with 7 group
companies and a turnover `3000cr+. TTK Prestige is its flagship company. It
started manufacturing in 1949 by setting up a unit near Bangalore. TTK was
incorporated as a private limited company in 1955 and it became a public
limited company in 1988. It remained a single product company till 1990. The
company is known for its manufacturing and innovations, be it distributing
pamphlets from helicopters in the fifties or introducing the exchange schemes.
Exhibit 7: Evolved from single product company
to a well diversified multi-product portfolio
Source: Company
Exhibit 8: Time line of the company
Year
Event/ development
1955
Incorporation
1959
First manufacturing unit in Bangalore
1981
Second manufacturing unit in Hosur
Till 1990
A single product company-just aluminum outer lid pressure cookers-dominant in southern India
1990-94
Launch of pressure cookers and non-stick cookware
1990s
Export thrust-launch of manttra brand
2000-03
Period of turbulences-yet bold initiatives laying the foundation for brand extension and explosive growth
Transformation into a total kitchen solution provider lead by innovations like induction tops, apple cookers, microwave
2006-10
pressure cookers and a host of appliances
2011
Largest capacity expansion initiatives to back the above vision
2012
Alliances with global high end brands entered for high end cookware/store ware/water filters/gas tops
2016
Entered new horizons -UK acquisition & cleaning solutions
Source: Company, Angel Research
August 17, 2018
3
Initiating Coverage
| TTK Prestige
Investment Rationale
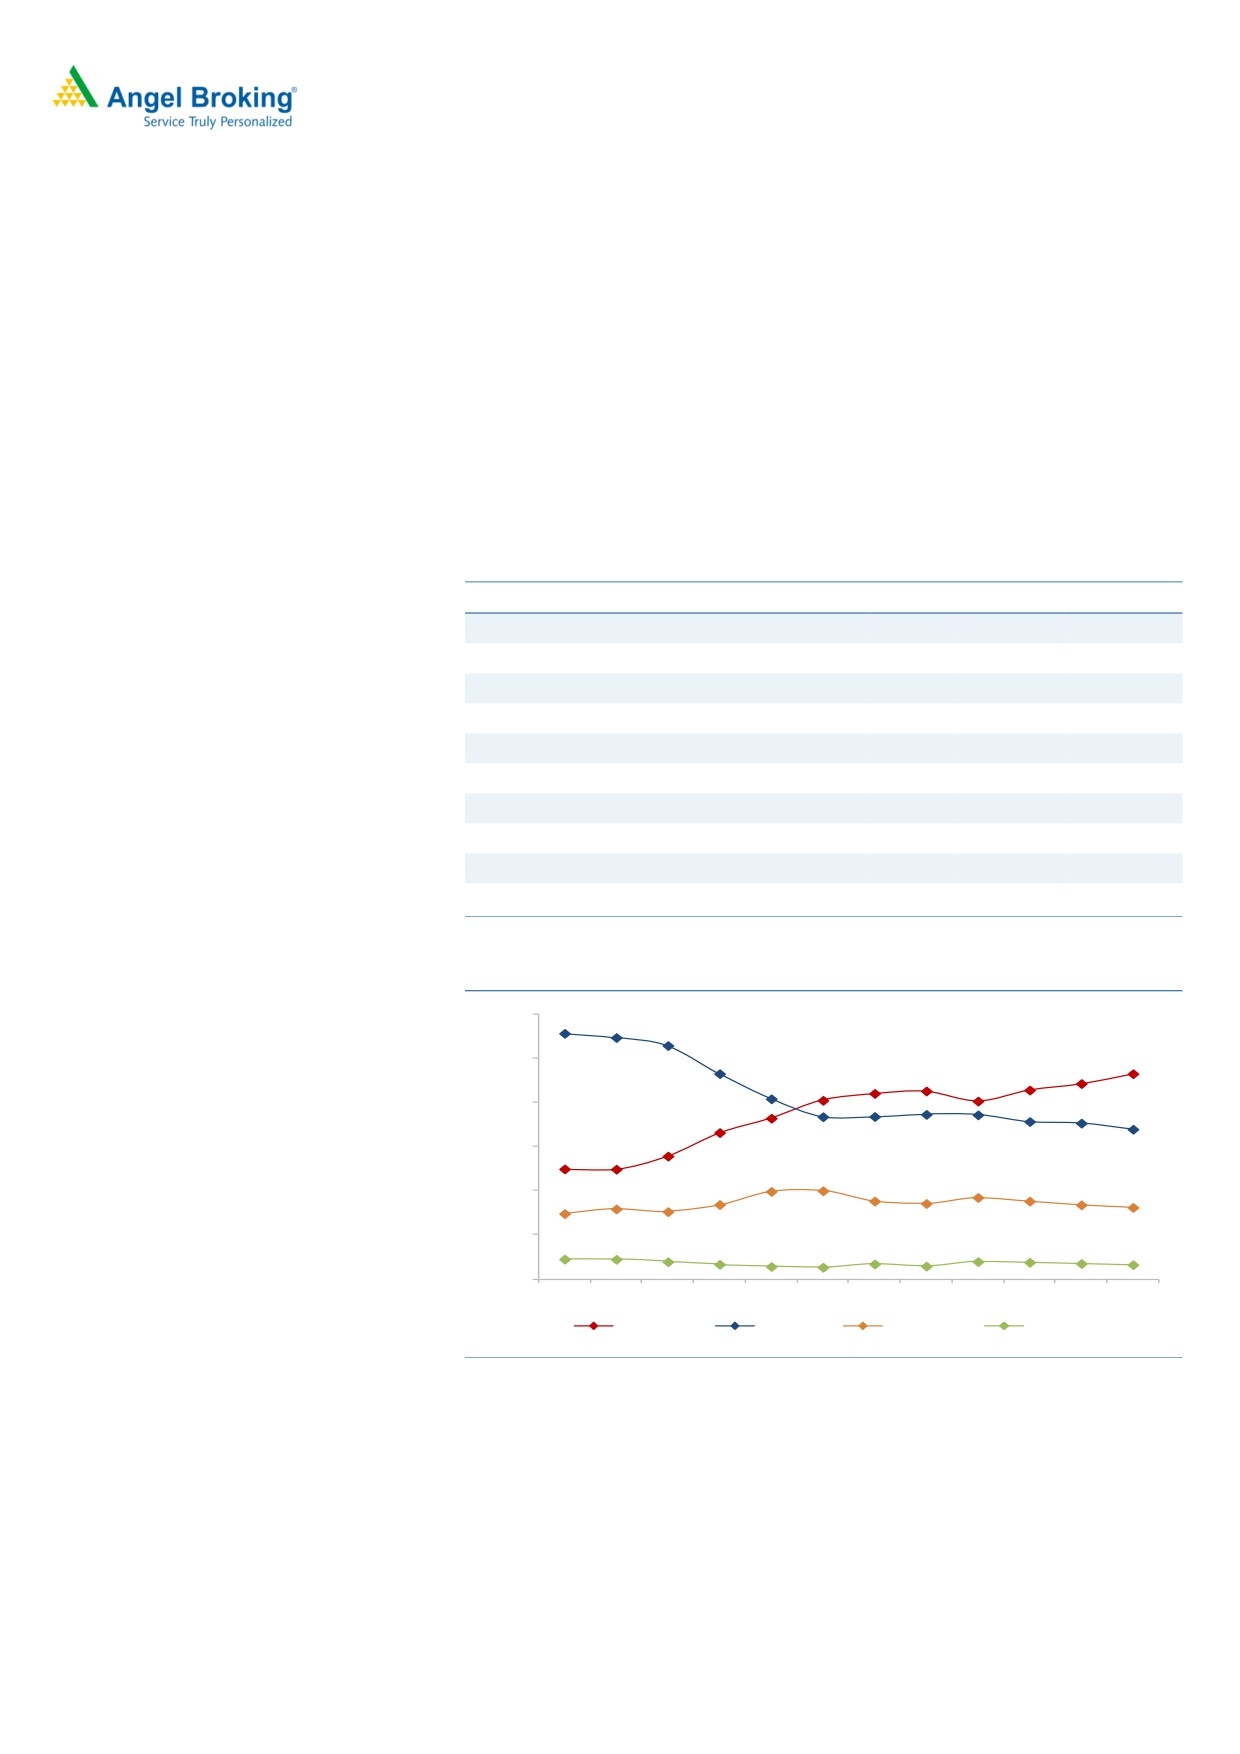
Leader in product innovation
TTK has been the first mover in introducing many pioneering products like non-
stick cookware, pressure cookware etc which has led to company garnering over
40% market share in organized market. Introduction of new appliances led to
reduction in revenue contribution from pressure cookers to 34% in FY2018 from
past level of 50%. The company is rebranding its exclusive branded outlets (17% of
sales) from ‘Prestige Smart Kitchen’ to Prestige Exclusive’ to re-energize its
traditional channels to offers its new launches. It has also launched a economy
range - Judge Cookware to capture the untapped demand especially rural at the
bottom end of the pyramid.
Exhibit 9: Product-wise revenue break up
` cr
FY08
FY14
FY18
Appliances
85
564
861
Cookers
186
494
628
Cookware
54
227
300
Others
15
39
60
Total Standalone revenue
340
1,323
1,849
As a % of revenue
Appliances
24.9%
42.6%
46.6%
Cookers
54.8%
37.3%
34.0%
Cookware
15.9%
17.1%
16.2%
Others
4.5%
2.9%
3.2%
Source: Company, Angel Research
Exhibit 10: Successfully diversified away from cookers segment
60.0%
50.0%
40.0%
30.0%
20.0%
10.0%
0.0%
FY07
FY08
FY09
FY10
FY11
FY12
FY13
FY14
FY15
FY16
FY17
FY18
Appliances
Cookers
Cookware
Others
Source: Company, Angel Research
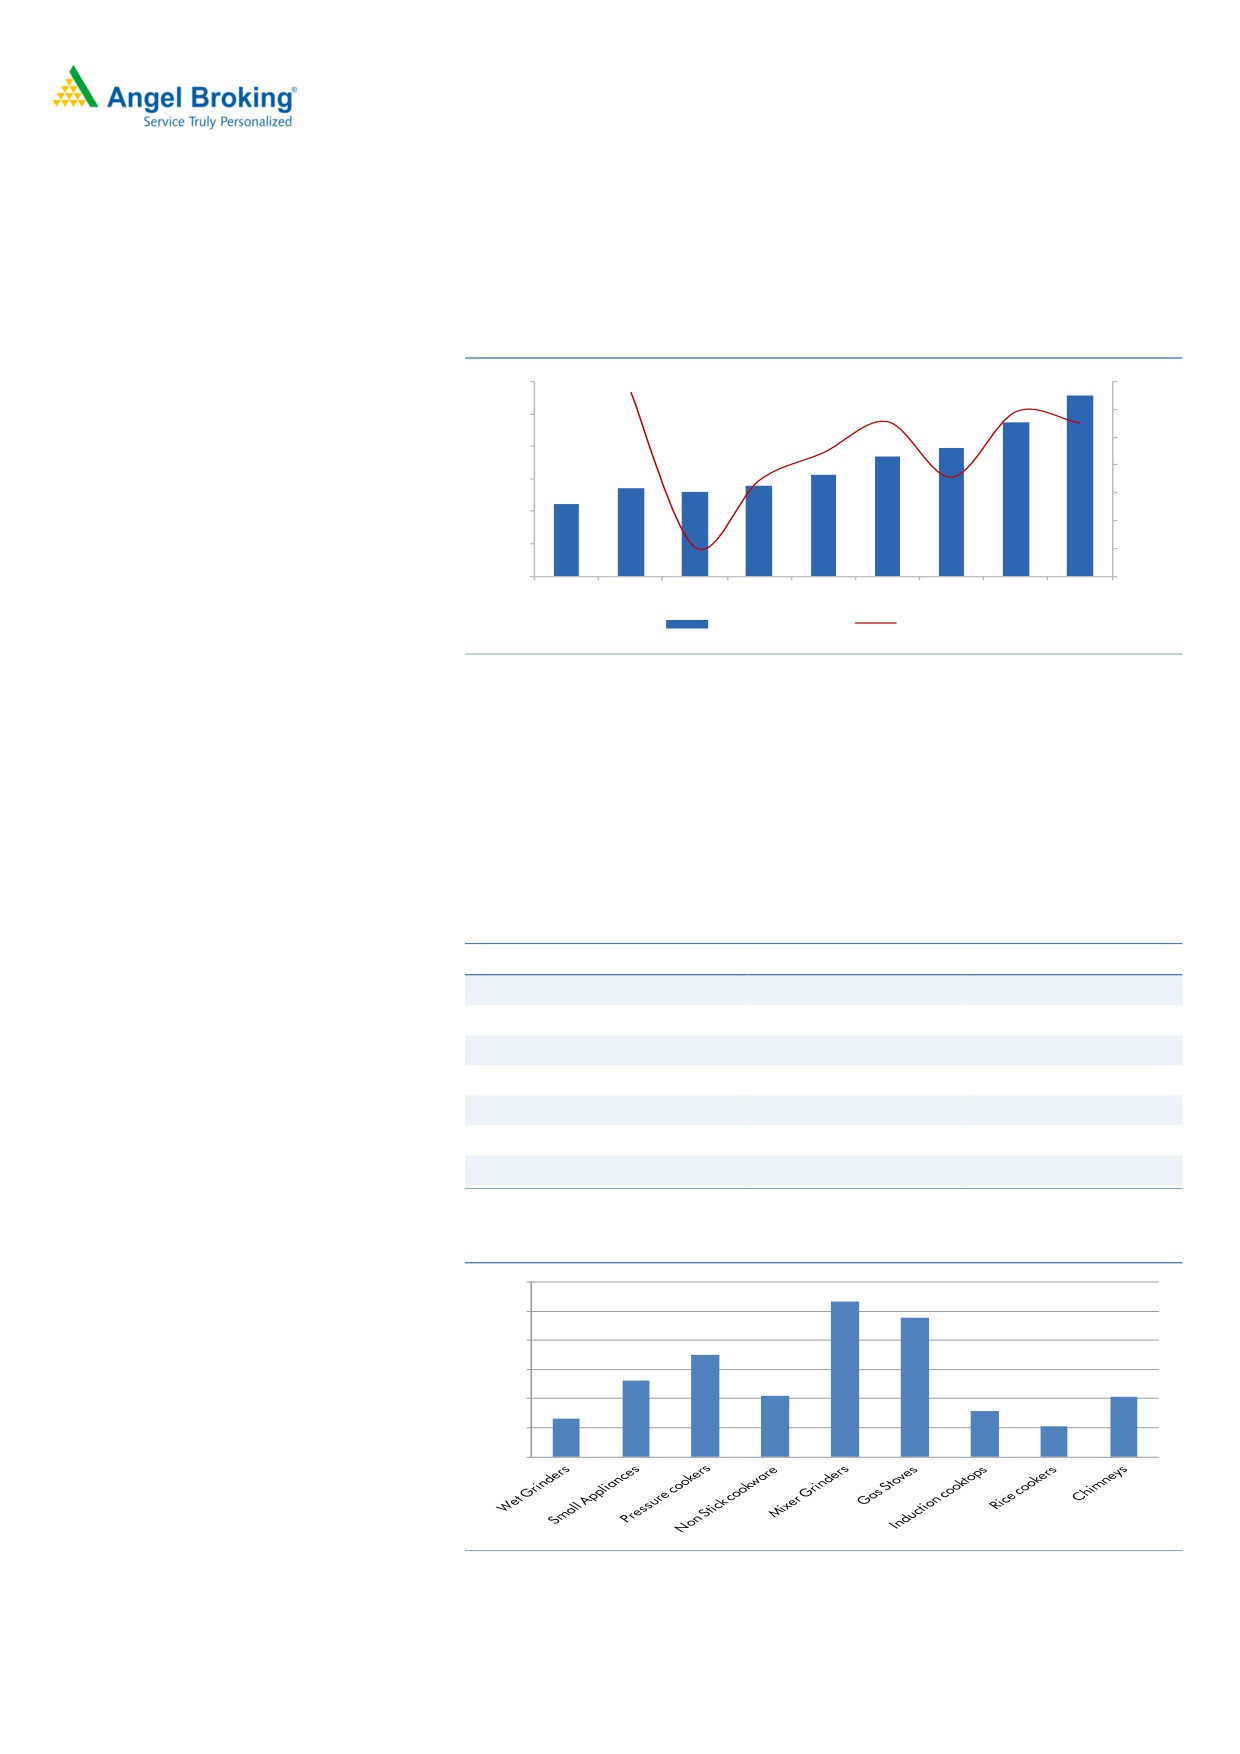
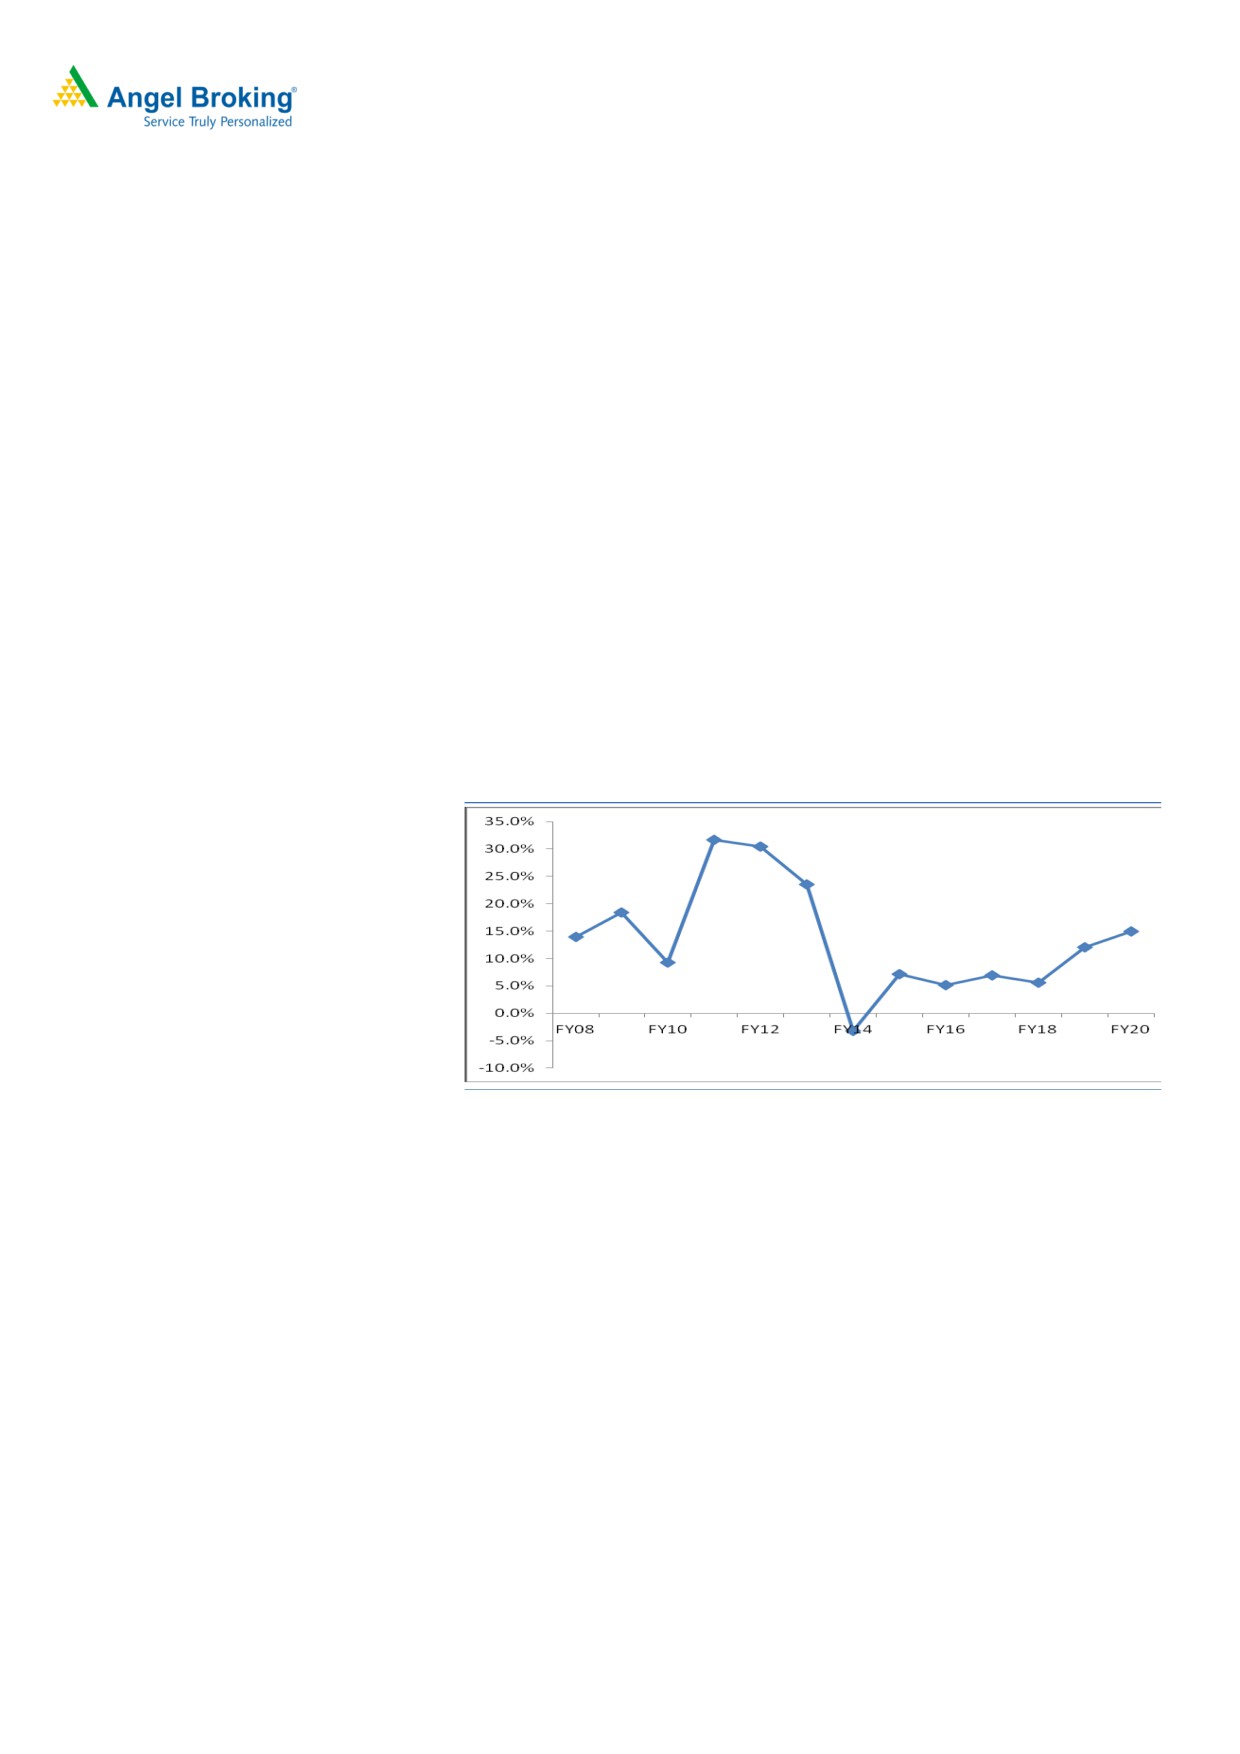
Growth to revive
The company has been annually launching 50-100 new products for the past few
years which led to diversification in its product portfolio away from pressure
cookers. In Q1FY2019 itself, there were 30 new launches and expects to launch
100 products in FY2019. Growth has revived un Q1FY2019 with 17.5% yoy
growth which is expected to continue for few more quarters.
After posting a couple of subdued years, we feel that the company is now in sweet
spot with revival in consumption demand especially rural, improving outlook for
August 17, 2018
4
Initiating Coverage | TTK Prestige
exports and the new 5 cr LPG connections in India which rekindle demand for
pressure cookers and cookware. It is also expecting exponential growth in cleaning
solutions and expects the segment revenue to grow from ~`23 cr in FY2018 to ~
`400 cr from in next five years.
Exhibit 11: Revenue growth to revive after a brief spell of slowdown
3000
25%
2500
20%
15%
2000
10%
1500
5%
1000
0%
500
-5%
0
-10%
FY12
FY13
FY14
FY15
FY16
FY17
FY18
FY19
FY20
Net Sales- ` cr
YoY chg (%)
Source: Company, Angel Research
Favorable market dynamics
Indian Kitchen appliances industry is valued at ~`12000cr where TTK commands
over 15% market share. Top 6 branded players form about 30% of market. The
2nd player - StoveKraft and 3rd player- Hawkins Cookers is having 1/3rd and 1/4th
of TTK’s revenue. Many other players have faced revenue fall like Nirlep for lack of
innovation whose market share has been acquired by TTK prestige.
Exhibit 12: Top 6 players forms ~30% of market
Revenue- ` Cr
Market Share %
TTK prestige
1982
17%
Stovecraft (Pigeon and Gilma brand)
650
5%
Hawkins
500
4%
Nirlep *
50
0%
Vinod ware
250
2%
Wonder chef
200
2%
Total organized market
3,632
30%
Source: Companies, media reports
* acquired by Bajaj Electrical in June 2018
Exhibit 13: Market size (` Cr) for TTK’s products
3000
2500
2000
1500
1000
500
0
Source: Company’s 2016 presentation
August 17, 2018
5
Initiating Coverage | TTK Prestige
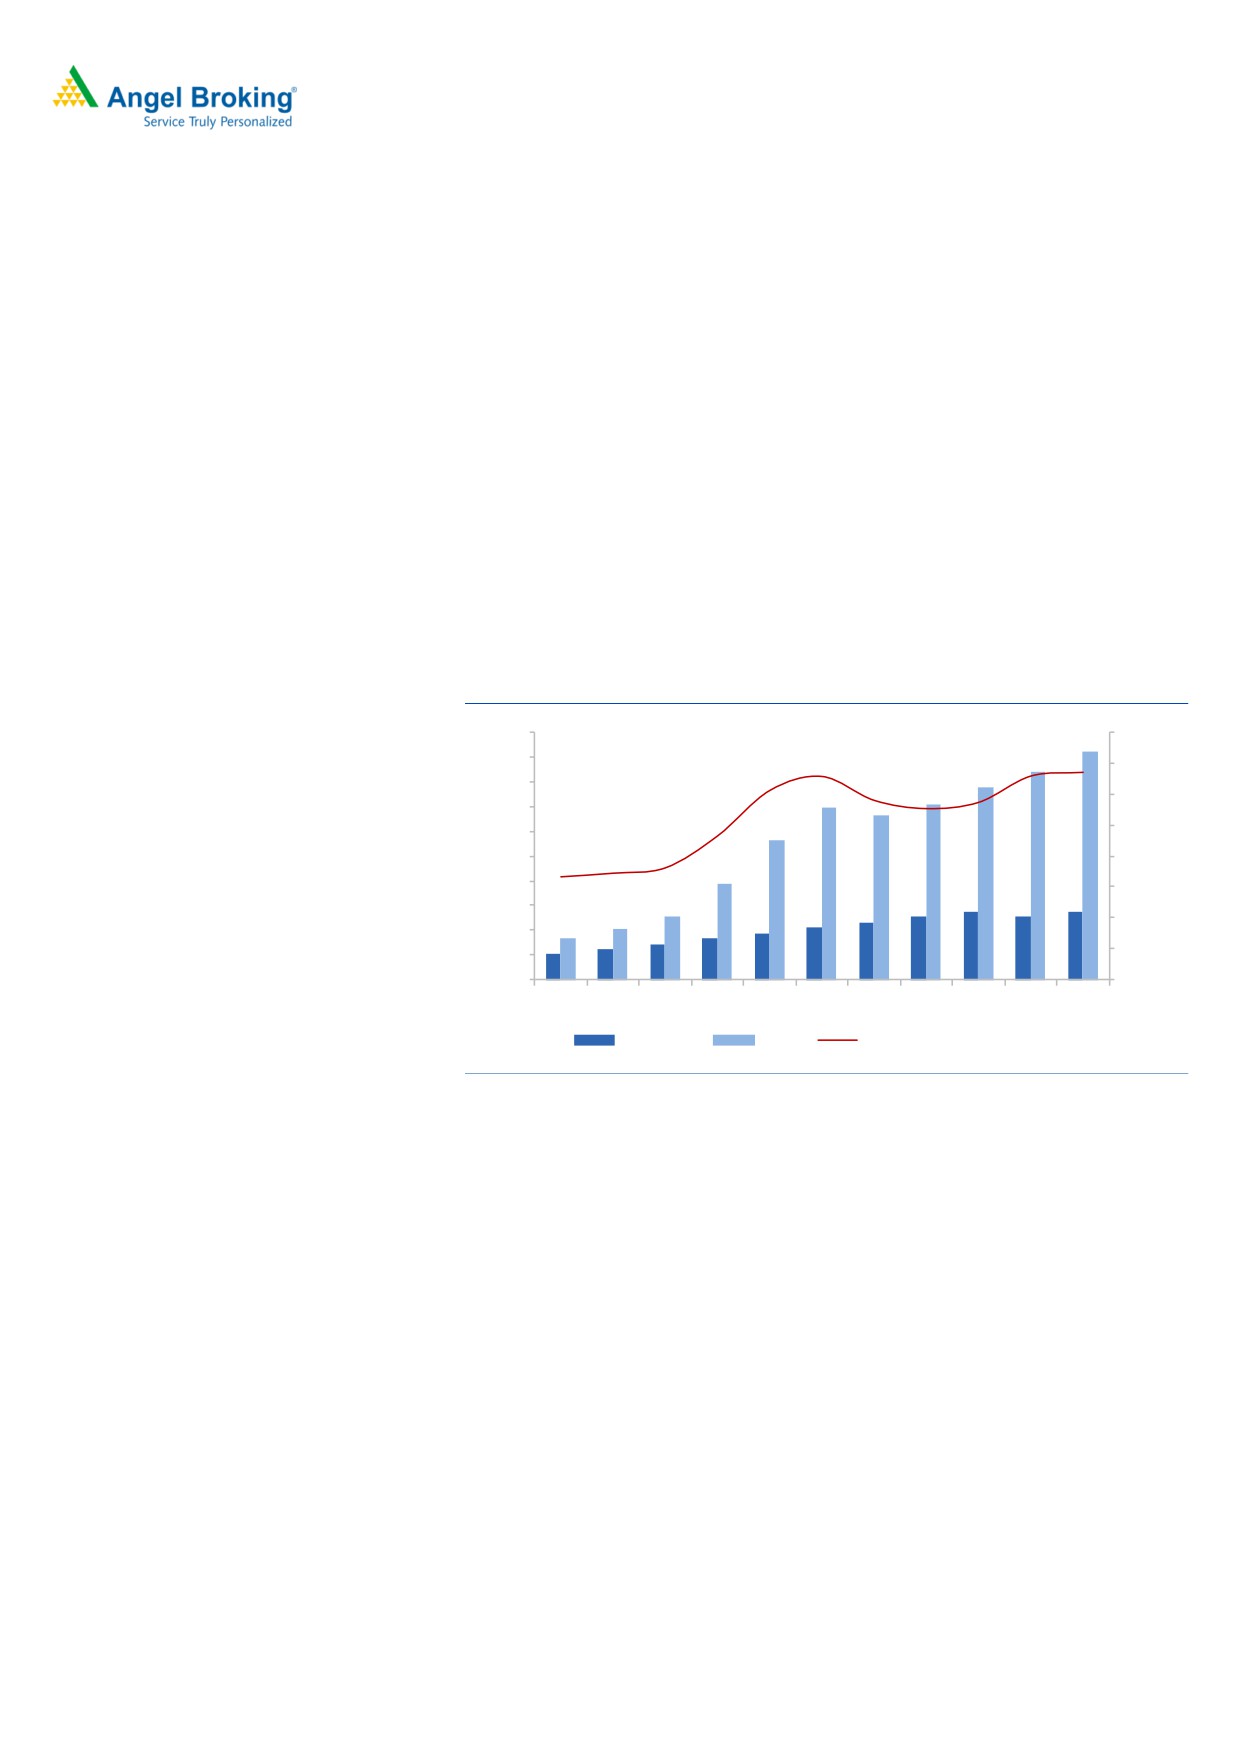
Ujjawala scheme -big boost to pressure cookers and cookware
Twenty-eight months since its launch, Pradhan Mantri Ujjwala Yojana (PMUY) has
already achieved the initial target of providing 5-crore LPG connections to BPL
households, and considering its success in the current year, the government has
revised the target to 8 crore with a budgetary allocation of `12,800 crore. As on
July 1, 2018, there are 23.5 cr LPG consumers in the country. As soon as a
household gets a LPG stove connection, one of the first appliances they buy is a
pressure cooker.
Pressure cooker industry to grow at double digit for next few years
Pressure cooker industry is estimated at `1,500-2,000 crore and has as many as
250 brands. TTK with over 35-40% market share is the leader with Hawkins and
United among the other key organised brands in the market. It is a mature market
and was seeing a single-digit growth of 5-6 % till recently which has now started
seeing a double-digit growth. While the penetration of pressure cookers is nearly
90% in urban regions, in rural areas it is just ~30 %. But Ujjwala seems to be
opening up the market in rural areas as well. TTK reported a 17.5% yoy growth in
pressure cooker in Q1FY2019 and expects similar run rate for next few quarters.
Exhibit 14: TTK ‘s pressure cookers sales to perk up
Source: Company, Angel Research Source: Company, Angel Research
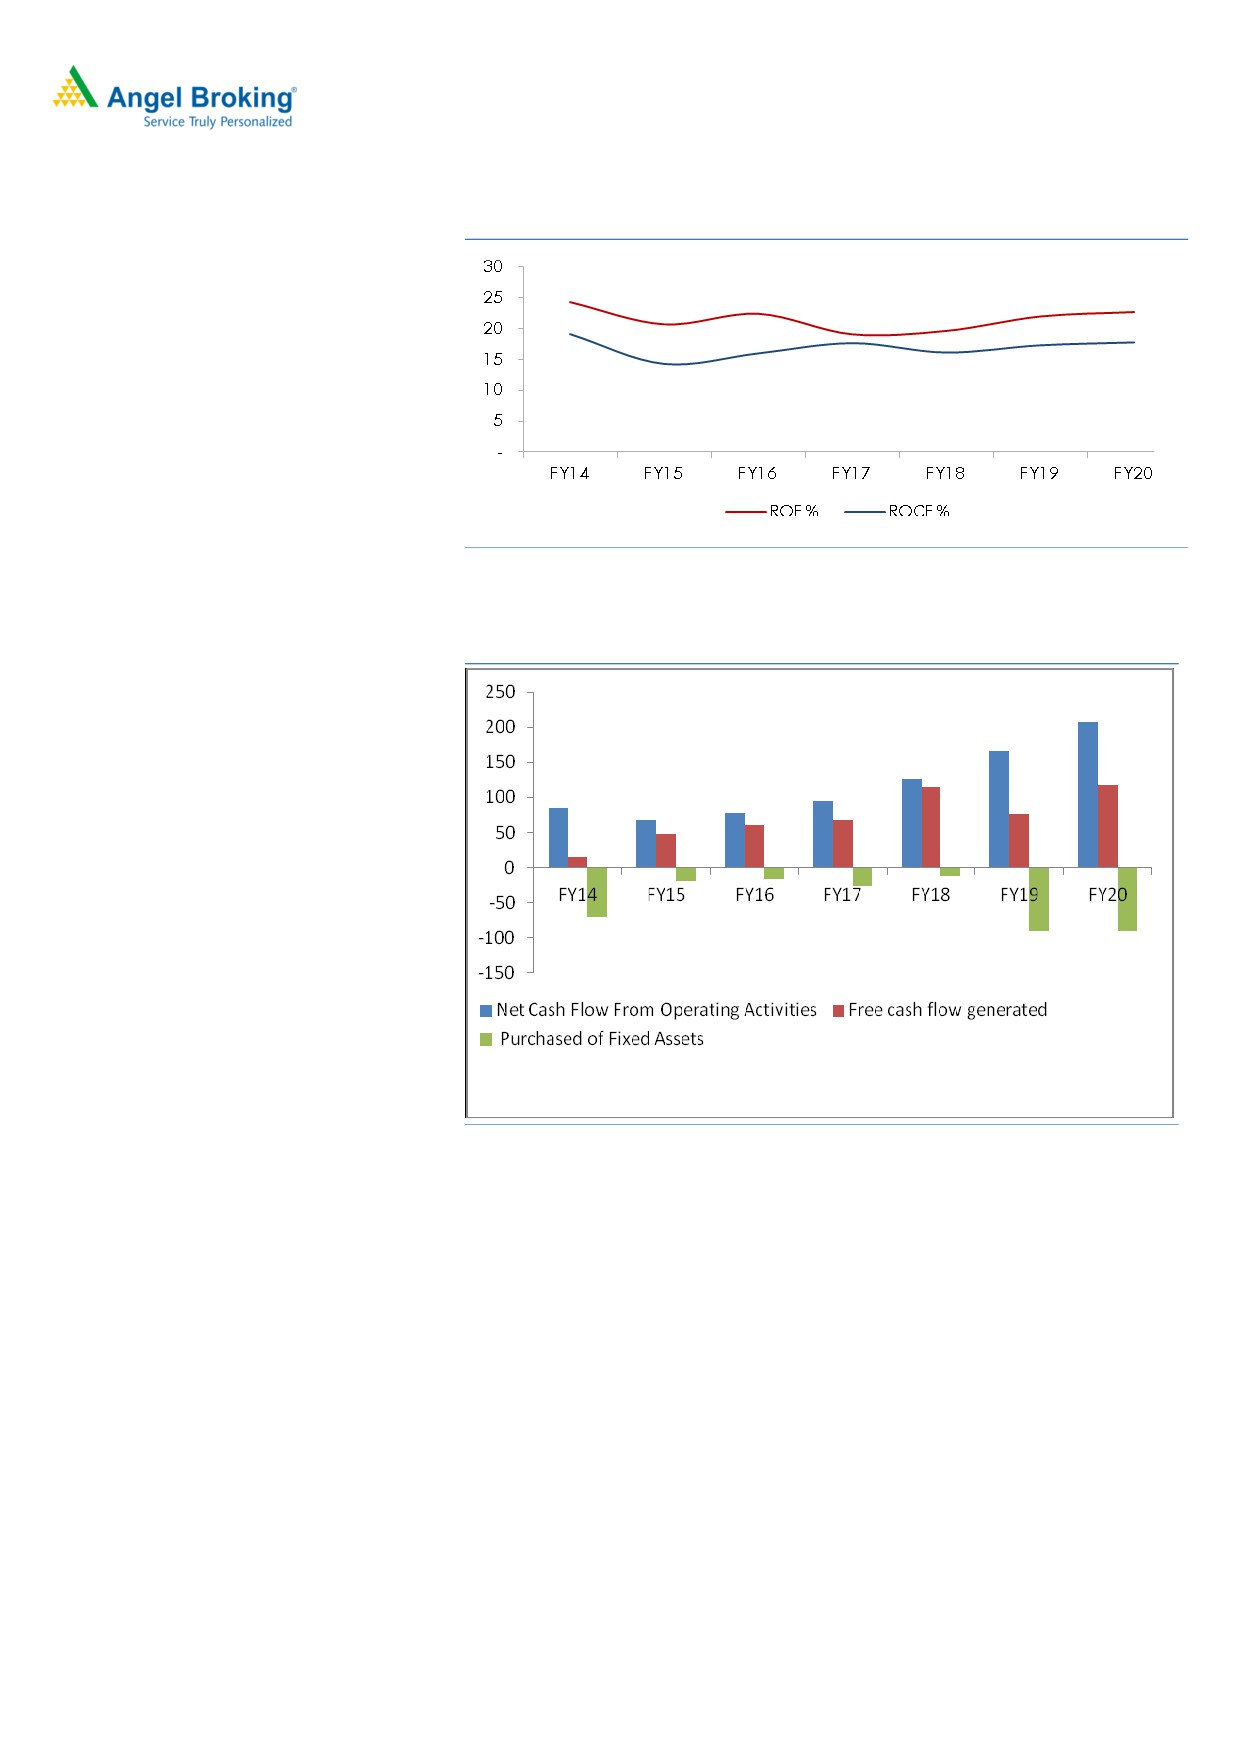
Strong balance sheet and improving ratios
The company is debt free and generated free cash flow in excess of `100 cr in
FY2018. The company has been investing in increasing its manufacturing
capabilities and invested over `500 cr in last 7-8 years. It has reduced outsourcing
to 20% from past higher levels of 40-50% (FY2012) to reduce working capital cycle
and foreign currency exposure. Looking at buoyant demand for its products, it is
likely to incur a capex of ~`250 cr over FY2019-21. This capex is to be internally
funded from its robust operating cash flows. With improving profitability, its return
ratios are expected to improve.
August 17, 2018
6
Initiating Coverage | TTK Prestige
Exhibit 15: Return ratios remain stable
Source: Company, Angel Research
Exhibit 16: Robust operating cash flow would funs its capex
Source: Company, Angel Research
August 17, 2018
7
Initiating Coverage | TTK Prestige
Outlook
TTK has posted a CAGR of 18% in revenue over FY2008-18backed by 26% CAGR
in appliances segment whereas cookers and cookware segments showed a somber
CAGR of 13/19% respectively. Going ahead, we expect that appliances segment
will grow at higher 23% CAGR while cookers and cookware will also see a revival
with 13-15% CAGR over FY2018-20. Margins are largely expected to improve
marginally in line with better product mix and improving scale. In view of its strong
balance sheet, we expect that PAT will grow by 23% CAGR over the same period.
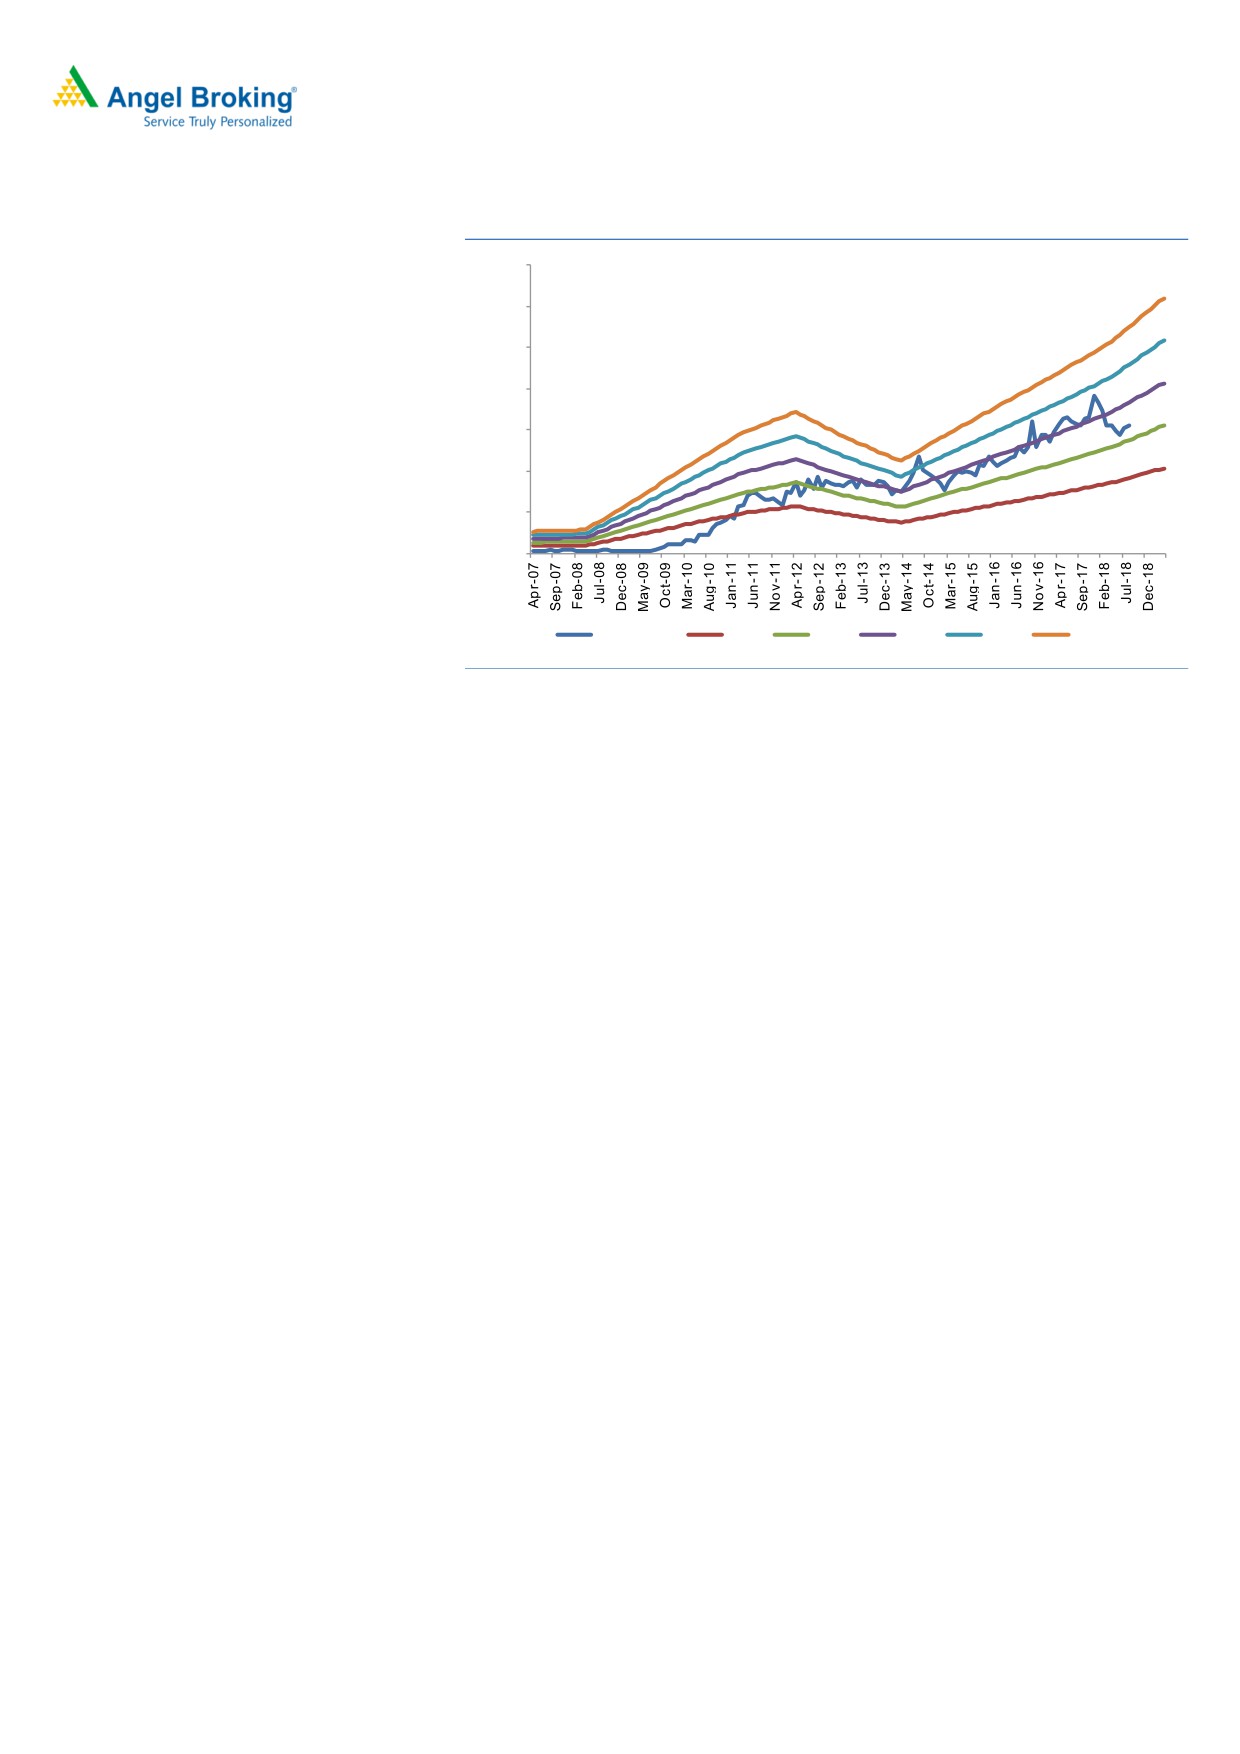
Competition analysis
TTK’s revenue was just 1.7x of that of Hawkins in FY2008. However, TTK widened
this gap at 3.3x in FY2018 by constantly introducing new products and distribution
expansion especially in North India. On the other hand, Hawkins remained
focused on the pressure cookers and cookware and hence suffered stagnation as
the cookers segment became highly penetrated segment.
Exhibit 17: TTK’s revenue growth outpaces its closet peer’s
400%
2000
1800
350%
1600
300%
1400
250%
1200
1000
200%
800
150%
600
100%
400
50%
200
0
0%
FY08
FY09
FY10
FY11
FY12
FY13
FY14
FY15
FY16
FY17
FY18
Hawkins
TTK
TTK as % of Hawkins revenue
Source: Companies, Angel Research
Valuation
The stock currently trades at a P/E of 29x FY2020E EPS which is at significant
discount to its past average 5 year PE multiple of 40x. Hence, looking at above
positive growth triggers, we initiate coverage on the stock with a BUY
recommendation and Target Price of `7500 (35x FY2020E EPS), an upside of 20%
from the current levels.
August 17, 2018
8
Initiating Coverage | TTK Prestige
Exhibit 18: Forward PE chart
14000
12000
10000
8000
6000
4000
2000
0
Share price
20 X
30 X
40 X
50 X
60 X
Source: Company, Angel Research
Risks and concerns
Abrupt fluctuations in its primary raw materials- Aluminum and steel whose prices
are linked to global commodity prices. Although the company has been able to
pass on the increase in raw material prices to consumers in the past owing to a
strong brand, any failure to do so in the future can adversely impact operating
margins.
Foreign exchange movement- The company imports raw materials and finished
goods from outside India as well as makes export sales to countries outside the
territories in which they operate from which exposes it to foreign currency risk.
Foreign currency exchange risks are managed by entering into forward contracts
against foreign currency vendor payables.
Excessive competition/ pricing war - TTK is competing with many different players
in different category. Many foreign players are also entering Indian markets which
could lead aggressive competition, pricing war. So far, TTK has gained market
share from its competition over the years with its innovative culture and growth
strategies.
August 17, 2018
9
Initiating Coverage | TTK Prestige
Income statement
Y/E March (` cr)
FY2016
FY2017
FY2018
FY2019E FY2020E
Total operating income
1,559
1,837
1,982
2,371
2,788
% chg
12.3
17.8
7.9
19.6
17.6
Total Expenditure
1,376
1,627
1,731
2,053
2,410
Raw Material
931
1,085
1,124
1,339
1,571
Personnel
114
138
159
185
217
Selling and Administration Expenses
313.8
374.0
421.0
497.9
585.5
Others Expenses
17
31
27
31
36
EBITDA
183
210
251
318
378
% chg
20.0
14.5
19.5
26.7
19.0
(% of Net Sales)
11.8
11.4
12.7
13.4
13.6
Depreciation& Amortisation
21
26
26
28
32
EBIT
162
184
225
289
346
% chg
21.4
13.4
22.3
28.6
19.5
(% of Net Sales)
10.4
10.0
11.4
12.2
12.4
Interest & other Charges
6
11
7
7
7
Other Income
10
11
141
20
25
(% of PBT)
6.2
5.9
39.4
6.6
6.9
Share in profit of Associates
-
-
-
-
-
Recurring PBT
167
184
359
302
364
% chg
25.1
10.2
95.3
(15.9)
20.4
Tax
51
33
96
97
116
(% of PBT)
30.7
18.1
26.6
32.0
32.0
PAT (reported)
116
151
263
205
247
Extraordinary Items
-
-
99
-
-
Less: Minority interest (MI)
0
0
0
0
0
PAT after MI (reported)
115
150
263
205
247
ADJ. PAT
116
151
165
205
247
% chg
25.2
30.3
9.2
24.9
20.4
(% of Net Sales)
7.4
8.2
8.3
8.7
8.9
Fully Diluted EPS (Rs)
100.0
130.3
142.3
177.7
214.0
% chg
25.2
30.3
9.2
24.9
20.4
Source: Company, Angel Research
August 17, 2018
10
Initiating Coverage | TTK Prestige
Balance sheet
Y/E March (` cr)
FY2016
FY2017
FY2018
FY2019
FY2020
SOURCES OF FUNDS
Equity Share Capital
12
12
12
12
12
Reserves& Surplus
711
842
1,008
1,175
1,381
Shareholders Funds
723
854
1,020
1,187
1,392
Equity Share Warrants
-
-
-
-
-
Total Loans
-
113
129
129
129
Deferred Tax Liability
-
-
-
-
-
Other liabilties
6.8
6.3
5.4
5.4
5.4
Total Liabilities
730
973
1,154
1,322
1,527
APPLICATION OF FUNDS
Gross Block
351
567
598
688
778
Less: Acc. Depreciation
21
58
108
137
169
Net Block
330
510
490
552
609
Capital Work-in-Progress
3
2
4
4
4
Investments
68
75
167
167
167
Current Assets
583
680
880
1,057
1,283
Inventories
325
380
437
523
615
Sundry Debtors
175
215
258
309
363
Cash
31
65
136
166
235
Loans & Advances
52
20
49
59
69
Other Assets
-
-
-
-
-
Current liabilities
238
281
373
445
522
Net Current Assets
346
400
507
612
761
Deferred Tax Asset
(29)
(35)
(42)
(42)
(42)
Total Assets
730
973
1,154
1,321
1,528
Source: Company, Angel Research
August 17, 2018
11
Initiating Coverage | TTK Prestige
Cash flow statement
Y/E March (` cr)
FY2016
FY2017
FY2018
FY2019
FY2020
Profit before tax
167
184
359
302
364
Depreciation
21
26
26
28
32
Change in Working Capital
0
0
0
(75)
(80)
Interest / Dividend (Net)
9
(0)
(6)
7
3
Direct taxes paid
(36)
(37)
(93)
(97)
(116)
Others
(83)
(78)
(159)
1
5
Cash Flow from Operations
78
94
127
166
207
(Inc.)/ Dec. in Fixed Assets
(17)
(26)
(12)
(90)
(90)
(Inc.)/ Dec. in Investments
11
(142)
9
20
25
Cash Flow from Investing
(6)
(168)
(3)
(70)
(65)
Issue of Equity
0
0
0
0
0
Inc./(Dec.) in loans
0
113
0
0
0
Dividend Paid (Incl. Tax)
0
0
0
0
0
Interest / Dividend (Net)
(2)
(8)
(75)
39
(31)
Cash Flow from Financing
(71)
106
(113)
0
(73)
Inc./(Dec.) in Cash
2
31
11
97
69
Opening Cash balances
25
27
58
69
166
Closing Cash balances
27
58
69
166
235
Source: Company, Angel Research
August 17, 2018
12
Initiating Coverage | TTK Prestige
Key Ratios
Y/E March
FY2016
FY2017
FY2018
FY2019
FY2020
Valuation Ratio (x)
P/E (on FDEPS)
62.4
47.9
43.8
35.1
29.1
P/CEPS
2.1
1.6
1.0
1.2
1.0
P/BV
0.4
0.3
0.3
0.2
0.2
Dividend yield (%)
0.4
0.4
0.5
0.5
0.6
EV/Sales
4.6
3.9
3.6
3.0
2.5
EV/EBITDA
38.8
34.2
28.1
22.1
18.3
EV / Total Assets
9.7
7.4
6.1
5.3
4.5
Per Share Data (`)
EPS (Basic)
100.0
130.3
142.3
177.7
214.0
EPS (fully diluted)
100.0
130.3
142.3
177.7
214.0
Cash EPS
118.1
152.6
250.1
202.1
241.9
DPS
22.0
27.0
30.0
33.0
36.3
Book Value
625.5
738.4
882.1
1,026.8
1,204.5
Dupont Analysis
EBIT margin
10.4
10.0
11.4
12.2
12.4
Tax retention ratio
0.7
0.8
0.7
0.7
0.7
Asset turnover (x)
2.5
2.2
2.3
2.4
2.5
ROIC (Post-tax)
18.0
18.2
19.5
20.0
21.0
Cost of Debt (Post Tax)
-
0.1
0.0
0.0
0.0
Returns (%)
ROCE
22.4
19.0
19.6
22.0
22.7
Angel ROIC (Pre-tax)
26.0
22.3
26.6
29.4
30.9
ROE
16.0
17.6
16.1
17.3
17.8
Turnover ratios (x)
Asset Turnover (Gross Block)
4.4
3.2
3.3
3.4
3.6
Inventory / Sales (days)
76
75
81
81
81
Receivables (days)
41
43
48
48
48
Payables (days)
93
94
121
121
121
Working capital cycle (ex-cash) (days)
24
24
7
7
7
Source: Company, Angel Research
August 17, 2018
13
Initiating Coverage | TTK Prestige
Research Team Tel: 022 - 39357800
DISCLAIMER
Angel Broking Limited (hereinafter referred to as “Angel”) is a registered Member of National Stock Exchange of India Limited, Bombay
Stock Exchange Limited, Metropolitan Stock Exchange Limited, Multi Commodity Exchange of India Ltd and National Commodity &
Derivatives Exchange Ltd It is also registered as a Depository Participant with CDSL and Portfolio Manager and Investment Adviser with
SEBI. It also has registration with AMFI as a Mutual Fund Distributor. Angel Broking Limited is a registered entity with SEBI for Research
Analyst in terms of SEBI (Research Analyst) Regulations, 2014 vide registration number INH000000164. Angel or its associates has not
been debarred/ suspended by SEBI or any other regulatory authority for accessing /dealing in securities Market. Angel or its
associates/analyst has not received any compensation / managed or co-managed public offering of securities of the company covered
by Analyst during the past twelve months.
This document is solely for the personal information of the recipient, and must not be singularly used as the basis of any investment
decision. Nothing in this document should be construed as investment or financial advice. Each recipient of this document should make
such investigations as they deem necessary to arrive at an independent evaluation of an investment in the securities of the companies
referred to in this document (including the merits and risks involved), and should consult their own advisors to determine the merits and
risks of such an investment.
Reports based on technical and derivative analysis center on studying charts of a stock's price movement, outstanding positions and
trading volume, as opposed to focusing on a company's fundamentals and, as such, may not match with a report on a company's
fundamentals. Investors are advised to refer the Fundamental and Technical Research Reports available on our website to evaluate the
contrary view, if any
The information in this document has been printed on the basis of publicly available information, internal data and other reliable
sources believed to be true, but we do not represent that it is accurate or complete and it should not be relied on as such, as this
document is for general guidance only. Angel Broking Limited or any of its affiliates/ group companies shall not be in any way
responsible for any loss or damage that may arise to any person from any inadvertent error in the information contained in this report.
Angel Broking Limited has not independently verified all the information contained within this document. Accordingly, we cannot testify,
nor make any representation or warranty, express or implied, to the accuracy, contents or data contained within this document. While
Angel Broking Limited endeavors to update on a reasonable basis the information discussed in this material, there may be regulatory,
compliance, or other reasons that prevent us from doing so.
This document is being supplied to you solely for your information, and its contents, information or data may not be reproduced,
redistributed or passed on, directly or indirectly.
Neither Angel Broking Limited, nor its directors, employees or affiliates shall be liable for any loss or damage that may arise from or in
connection with the use of this information.
Disclosure of Interest Statement
TTK PRESTIGE
1. Financial interest of research analyst or Angel or his Associate or his relative
No
2. Ownership of 1% or more of the stock by research analyst or Angel or associates or relatives
No
3. Served as an officer, director or employee of the company covered under Research
No
4. Broking relationship with company covered under Research
No
Ratings (Based on expected returns
Buy (> 15%)
Accumulate (5% to 15%)
Neutral (-5 to 5%)
over 12 months investment period):
Reduce (-5% to -15%)
Sell (< -15)
August 17, 2018
14